




Creatine
Where America's creatine ships from
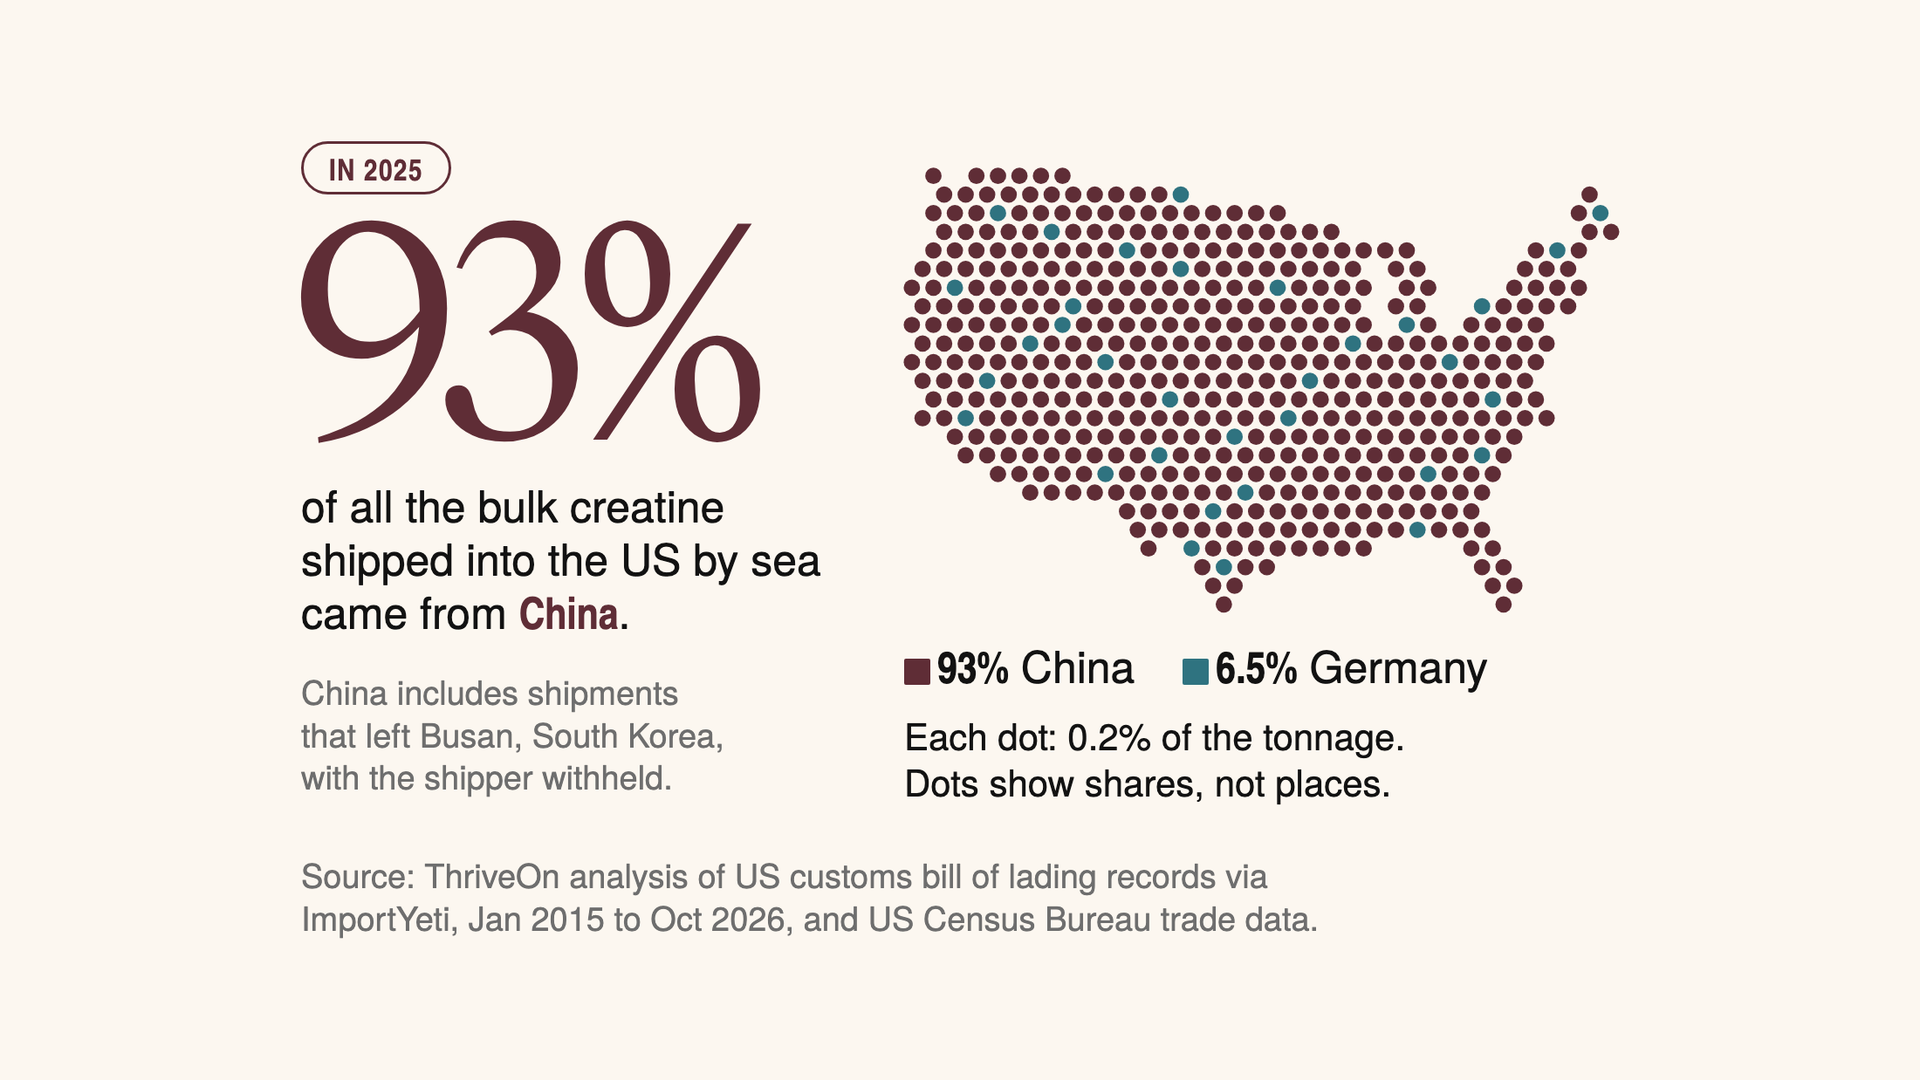
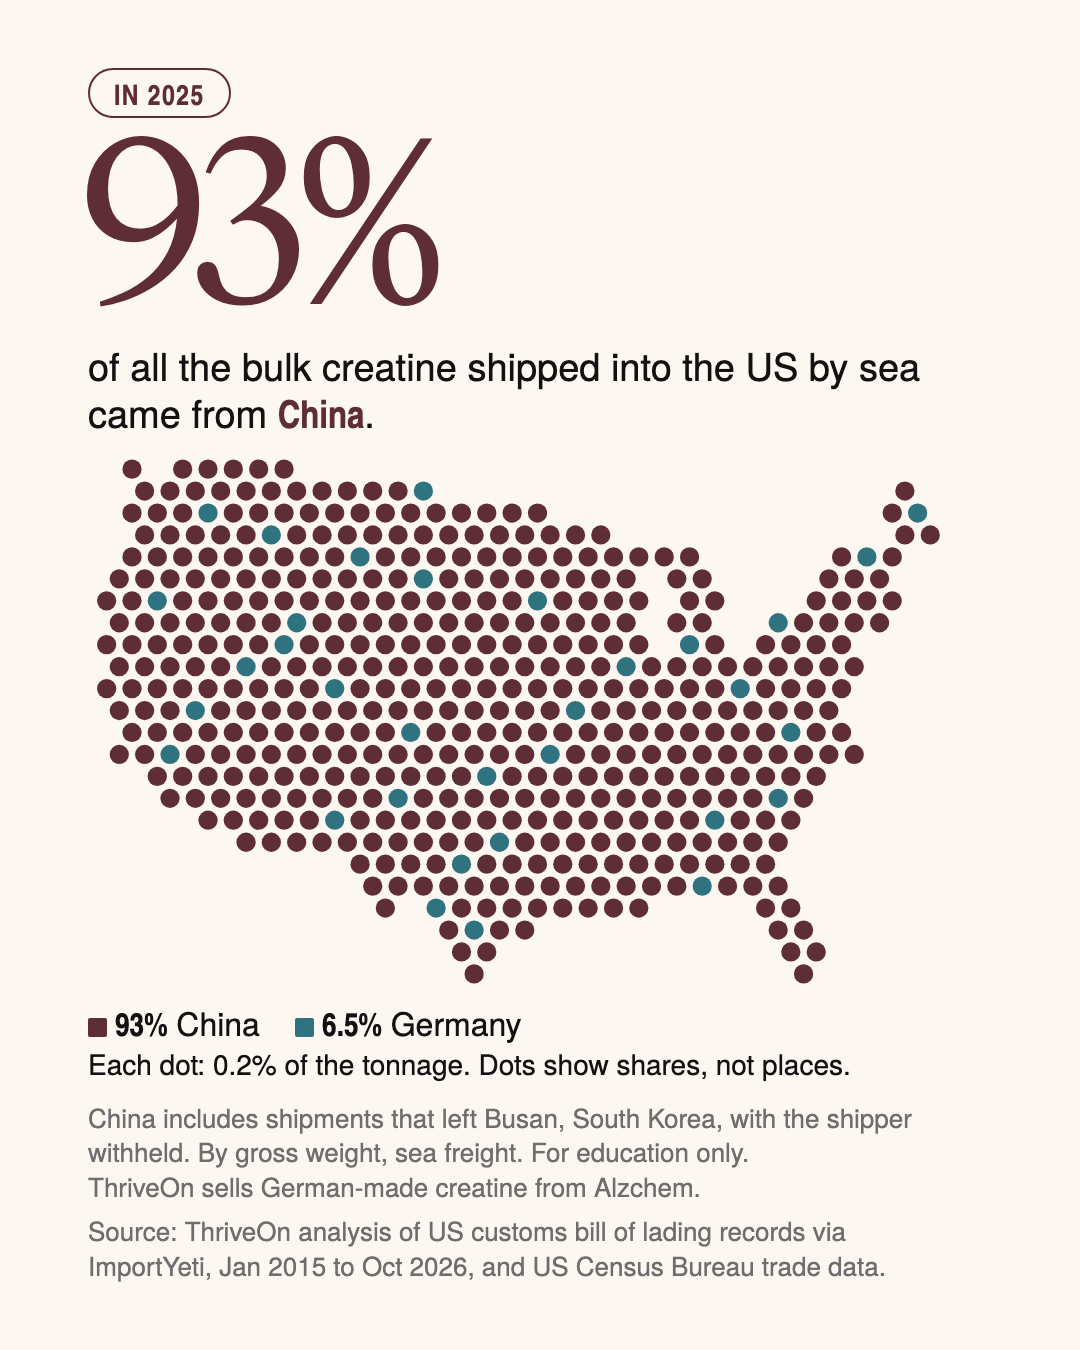
In 2025, 93% of all the bulk creatine shipped into the US by sea came from China. We counted it from 24,254 US customs records, January 2015 to October 2026.

In 2025, 93% of all the bulk creatine shipped into the US by sea came from China. We counted it from 24,254 US customs records, January 2015 to October 2026.
What the animation shows
It opens on the counts behind this analysis: 24,254 US customs records, 12 years of imports and 17 US ports of entry. Squares, each standing for 25 records, drop away until 5,669 shipments of bulk creatine remain, about 150,000 metric tons in all. The shipments are then sorted by the country each came from: 5,012 from China, including 103 that left Busan, South Korea, with the shipper withheld; 629 from Germany; and 28 from elsewhere. Bars rise year by year from 2015 to 2026: US sea imports from China average about 5,000 metric tons a year through 2021, then climb to 32,038 in 2025, about six times 2015, while Germany's 2023 and 2024 are marked as all-routes estimates. A map of the US made of 500 dots shows 2025: 93% China and 6.5% Germany by sea, or about 92% and 7.5% counting German-made creatine that came in overland. A line then shows 2026 passing the 2025 total of 34,314 metric tons on 14 October. It ends on a question: does your label say where the creatine was made?
The US government publishes import figures for thousands of goods, but its trade statistics cannot say how much creatine the country brings in. Bulk creatine is entered under a catch-all customs line, HTS 2925.29.90, which it shares with other chemicals such as guanidinoacetic acid, an animal feed additive. Official trade statistics stop at that line.
So we counted the shipments ourselves, from US customs records of cargo arriving by sea. In 2025, 93% of all the bulk creatine shipped into the US by sea came from China: 32,038 of 34,314 metric tons. Germany supplied 6.5%. Every other country together supplied 0.1%.
China's share has grown with the volume. In 2015, about one metric ton in five came from Germany. By 2025 it was about one in 15, as US imports from China rose about six times.
Why the source matters
Creatine is sold as powder, gummies and blends, and the volume shipped into the US by sea grew five-fold between 2015 and 2025. Only a few places make it. Alzchem, which makes creatine in Trostberg, Germany, describes itself as the only producer outside Asia. In our records, 5,012 of the 5,040 bulk creatine shipments that did not come from Germany came from China.
For a buyer, the more useful question is who made the creatine, and how. Makers can differ in raw materials, process and testing, wherever they are, and a third-party test shows what was in one lot, not who made the creatine or how.
How we counted
US Customs and Border Protection makes part of every ocean shipping manifest public: the shipper and the consignee, the port the cargo left from, the US port where it arrived, a written description of the goods and their weight. The data elements are set out in 19 CFR 103.31. We used these bill of lading records through ImportYeti, a platform that publishes them, for January 2015 to October 2026. We publish only our own yearly totals, not the records, and we name no importer and no maker other than Alzchem.
We searched the cargo descriptions and carton markings for creatine and its spellings, including the German “creatin,” and for the brand names Creapure® and Creavitalis®. We also searched for shipments from Alzchem and its Trostberg plant, from six large creatine makers in China, and for the customs code creatine is filed under. Those searches returned 24,254 records. We classified every one against written rules.
Most were not shipments of bulk creatine. We removed duplicate filings (a carrier's master bill and the house bills beneath it often describe the same cargo), cargo passing through US ports to other countries, shipments consigned to companies outside the US, mixed loads that did not state how much creatine they held, other chemicals filed under the same customs code, finished products (counted separately) and goods that only shared the word, among them a toy playset listed as “Creatin Cakes.” That left 5,669 shipments of bulk creatine, about 150,000 metric tons in all, arriving through 17 US ports.
For each shipment we assigned the country it came from using the record itself, in this order: a brand that only one maker produces, a named maker, the shipper's address, the pickup location, then the departure port. We did not use the platform's own country field, which often follows the departure port and misreads some addresses. It labels shipments from Bavaria as coming from Belarus, for example.
We then checked our counts against official statistics from the US Census Bureau and UN Comtrade. Neither can isolate creatine, but both set limits our numbers must sit inside, and they do. UN Comtrade's figures for all US imports under that line put China at about 64% and Germany at about 14% in 2025, because the line also holds other chemicals and Comtrade counts every route by country of origin. Where German-made creatine arrived by sea, Census entries in the customs district where it is entered matched our sea count within about 8% in each year we could test it: 2015 to 2019, 2022 and 2023. The methodology appendix lists our searches, rules and exclusion counts.
What we found, year by year
| Year | China | of which: left Busan, shipper withheld | Germany | Other countries | Total |
|---|---|---|---|---|---|
| 2015 | 5,350 | 0 | 1,484 | 0 | 6,834 |
| 2016 | 4,237 | 0 | 939 | 0 | 5,176 |
| 2017 | 4,890 | 43 | 1,223 | 0 | 6,113 |
| 2018 | 6,017 | 0 | 1,499 | 27 | 7,543 |
| 2019 | 4,690 | 0 | 956 | 21 | 5,667 |
| 2020 | 5,049 | 269 | 315 | 0 | 5,364 |
| 2021 | 5,237 | 77 | 592 | 2 | 5,831 |
| 2022 | 8,953 | 0 | 552 | 7 | 9,512 |
| 2023 | 10,246 | 127 | 1,700 est. | 0 | 11,946 |
| 2024 | 16,180 | 400 | 2,000 est. | 0 | 18,180 |
| 2025 | 32,038 | 2,380 | 2,245 | 31 | 34,314 |
| 2026 (Jan to 25 Oct) | 34,664 | 1,260 | 1,522 | 428 | 36,614 |
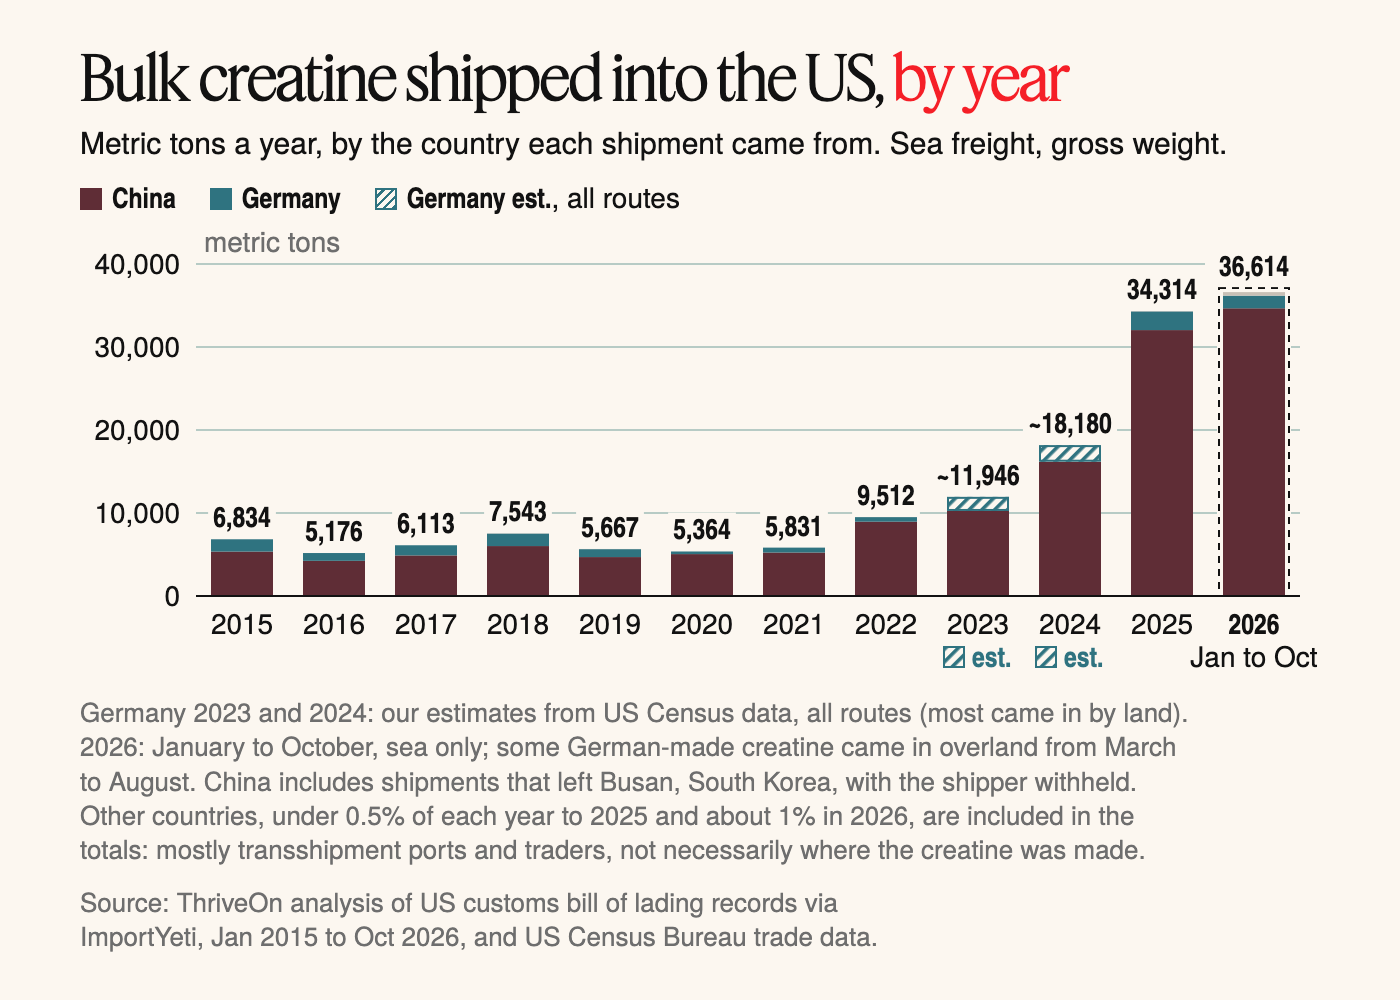
Metric tons, gross shipping weight, bulk creatine shipped into the US by sea, by the country each shipment came from. China includes shipments that left Busan, South Korea, with the shipper withheld. Germany 2023 and 2024 (est.) are our estimates of German-made creatine by all routes, most of it by land, built from US Census trade data in net weight (about 5.5% below gross); the sea records alone show 381 and 65 metric tons. The sea records total 149,838 metric tons over all years; with the two estimates, the column adds to 153,094.
In 2015, ships brought 6,834 metric tons of bulk creatine into the US: 5,350 from China and 1,484 from Germany.
Through 2021, US sea imports of bulk creatine from China averaged about 5,000 metric tons a year. Then they took off: 8,953 metric tons in 2022, 16,180 in 2024 and 32,038 in 2025, about six times the 2015 figure.
German-made creatine grew far more slowly, to 2,245 metric tons by sea in 2025. From early September 2023 to late November 2024, US sea records show almost none. US Census entries show it kept arriving overland, probably via Canada. We estimate about 1,700 metric tons in 2023 and 2,000 in 2024 by all routes, and mark those two years as estimates in every chart and table.
Alzchem, which makes creatine in Germany, says demand is still growing: in December 2025 it approved about €120 million to expand production of creatine and its precursors, with new capacity from the second half of 2027.
2026 is higher still. By mid-October, imports for the year had passed all of 2025, and they reached 36,614 metric tons by 25 October.
Each year's share
| Year | China | Germany | Other countries |
|---|---|---|---|
| 2015 | 78.3% | 21.7% | 0.0% |
| 2016 | 81.9% | 18.1% | 0.0% |
| 2017 | 80.0% | 20.0% | 0.0% |
| 2018 | 79.8% | 19.9% | 0.4% |
| 2019 | 82.8% | 16.9% | 0.4% |
| 2020 | 94.1% | 5.9% | 0.0% |
| 2021 | 89.8% | 10.2% | 0.0% |
| 2022 | 94.1% | 5.8% | 0.1% |
| 2023 | 85.8% est. | 14.2% est. | 0.0% |
| 2024 | 89.0% est. | 11.0% est. | 0.0% |
| 2025 | 93.4% | 6.5% | 0.1% |
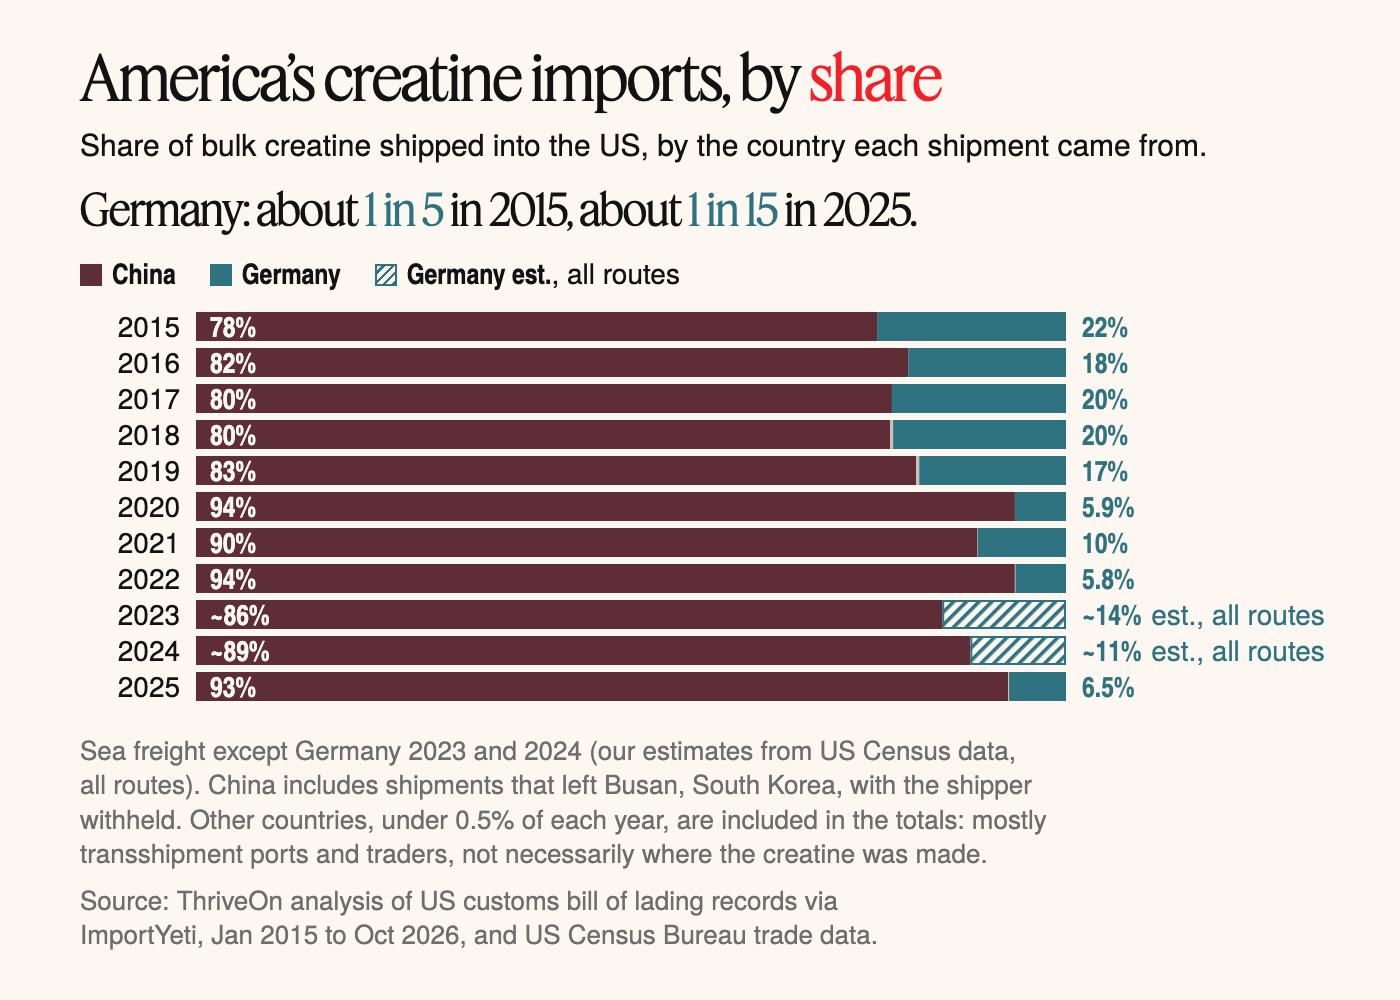
Share of the year's bulk creatine shipped into the US, by the country each shipment came from. Sea freight, except 2023 and 2024 (est.), where Germany uses our all-routes estimates. Germany's 2021, 2022 and 2025 shares are sea-only and probably low: some German-made creatine also came in overland in late 2021 to early 2022 and in January to March 2025; counting it, 2025 was about 92% China and 7.5% Germany. No 2026 share is given: German-made creatine came partly overland from March to August 2026, so a sea-only share would understate it.
Germany's share fell from about 1 in 5 in 2015 to about 1 in 15 in 2025. German-made volume grew, but China's grew much faster. The 2023 and 2024 shares use the Germany estimates, so they are approximate. We do not give a 2026 share: German-made creatine came partly overland again from March to August 2026, so a share from sea records alone would understate it.
What the 93% includes
Of the 34,314 metric tons that arrived by sea in 2025, 29,658 (86.4%) were in shipments the records trace to China: a named Chinese maker, a shipper's address in China or a pickup location in China. Another 2,380 metric tons (6.9%) left Busan, South Korea, with the shipper's name withheld. We count those as China, which brings China to 32,038 metric tons, or 93%.
We found no creatine maker in South Korea. In our records, every Busan shipment that names a maker names a Chinese one, and Busan is one of the world's largest transshipment ports, carrying cargo from northern China to the US. Counting none of the withheld Busan shipments as China, and leaving them unassigned, would still put China at 86.4%, more than 13 times Germany.
Germany supplied 2,245 metric tons (6.5%) and all other countries 31 (0.1%). Because the records cover ocean freight only, these are shares of what came by sea. Adding the German-made creatine that came in overland from January to March 2025, China was about 92% and Germany about 7.5%. Any overland arrivals from China cannot be separated from other chemicals in the Census data, so they are not added.
What the data can and cannot say
- It covers ocean freight only. Air cargo manifests are not public, and goods that cross a land border do not appear. That is why German-made creatine that came in overland is missing from the sea records in some years.
- It shows where a shipment came from and who sent it, not where the creatine was made. A shipment can leave one country after being made in another.
- Weights are gross shipping weights declared by the shipper, packaging and pallets included, in metric tons.
- Importers can ask customs to withhold their own names and their shippers' names. Those shipments still appear with the names blanked, and we counted them.
- Finished creatine products such as tubs and gummies are counted separately and left out of these totals (238 metric tons in 2025). Mixed loads that did not state their creatine weight are left out.
- Our China figures for earlier years are probably understated (the appendix explains why), so growth since 2015 may be somewhat smaller than the records show. 2026 is a partial year, January to 25 October.
- These are US imports, not world production.
The methodology appendix covers each of these in detail.
The label question
These records answer a national question: where America's bulk creatine ships from. They cannot answer the one a buyer has at home: where the creatine in this tub was made, and by whom.
Not every label says where the creatine itself was made. Some name the maker or the country, sometimes through a branded ingredient whose maker is public.
None of this means creatine made in China is a problem. Some creatine made in China is good, and quality varies from maker to maker and lot to lot, wherever creatine is made. Not every label says which maker made it. So the useful question for any tub is a short one: does the label say who made the creatine, and where?
Method, data and how to cite
- Methodology
- Methodology appendix: sources, searches, counting rules, exclusion counts and cross-checks.
- Data
- Yearly figures with definitions and limits: CSV and XLSX.
- How to cite this
- ThriveOn analysis of US customs bill of lading records, January 2015 to October 2026. “Where America's creatine ships from,” ThriveOn, 31 October 2026. https://trythriveon.com/blogs/news/us-creatine-imports
- Last updated
- 31 October 2026. Data through 25 October 2026.
- Corrections
- We correct errors as soon as we confirm them and log every change, with its date, in the methodology appendix. Send corrections to care@trythriveon.com.
Press kit
- Charts (PNG): 2025 map, wide (16:9), metric tons by year, share by year, 2025 map, portrait (4:5).
- Animation (1920 x 1080): narrated MP4, silent MP4, captions (VTT), and on YouTube for embedding.
- Data: CSV, XLSX. Method: methodology appendix.
- You may republish the data and charts with credit to ThriveOn and a link to this page.
About ThriveOn. ThriveOn is a US supplement company founded by Victoria O'Hare and Andrew O'Hare. Its products include ThriveOn Stronger, a daily sachet, and ThriveOn Creatine, made with Creavitalis® creatine from Alzchem: creatine made in Germany, packaged in the USA. Because it sells creatine, ThriveOn has an interest in where creatine comes from, so this analysis uses public records and publishes its method and data.
Press contact: care@trythriveon.com